
Have you ever wondered why poverty in America seems to struggle more than others? What factors contribute to the high poverty rates in these states? You’re in the right place, if you’re curious about the elements affecting the poorest states in America.
By reading this blog, you’ll gain a deeper understanding of the socio-economic realities in America’s poorest states. Moreover, you’ll discover how factors like education, industry dependence, and historical context contribute to their high poverty rates.
In this blog, we’ll explore the 10 poorest states in America, whether you’re wondering what’s the poorest state in America right now or how the richest and poorest states in America compare side by side. So, let’s begin!
Quick Answers
- What is the poorest state in America? Louisiana currently holds that title, according to the latest Census Bureau data, narrowly ahead of Mississippi.
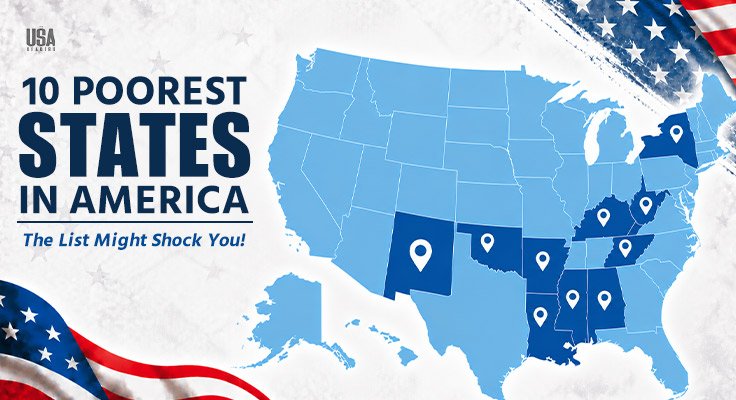
- The 10 states with the highest poverty rates: Louisiana, Mississippi, New Mexico, West Virginia, Kentucky, Oklahoma, Arkansas, Alabama, New York, and Tennessee.
- The 10 richest states by median household income: Massachusetts, New Jersey, Maryland, Hawaii, California, New Hampshire, Washington, Colorado, Utah, and Connecticut.
- Richest state vs. poorest state: Massachusetts leads at $104,828 in median household income. Mississippi sits lowest at $59,127, a gap of nearly $46,000 a year.
- Poorest city in America: Among the 10 largest U.S. cities, Houston recently passed Philadelphia for the highest poverty rate. Among all major cities, Detroit has held that title for years.
| Rank | State | Poverty Rate | Median Household Income |
| 1 | Louisiana | 18.9% | $60,986 |
| 2 | Mississippi | 18.0% | $59,127 |
| 3 | New Mexico | 17.8% | $67,816 |
| 4 | West Virginia | 16.7% | $60,798 |
| 5 | Kentucky | 16.4% | $64,526 |
| 6 | Oklahoma | 15.9% | $66,148 |
| 7 | Arkansas | 15.7% | $62,106 |
| 8 | Alabama | 15.6% | $66,659 |
| 9 | New York | 14.2% | $85,820 |
| 10 | Tennessee | 14.0% | $71,997 |
The national poverty rate currently sits at 12.1%. Every state on this list runs well above that.
Louisiana
- Poverty Rate: 18.9%
- Unemployment Rate: 4.4%
- Average Salary: ~$59,800 a year
- Estimated population: 4.60 million
Louisiana, one of the poorest states in America, has a unique blend of vibrant culture and significant economic challenges. Based on the latest poverty rate data, it is currently the poorest state in America, narrowly ahead of Mississippi. Louisiana’s history is based on racial discrimination and economic disparity.
Moreover, the state’s economy depends on industries like oil and gas, fishing, and tourism. However, these industries are often subject to fluctuations in global markets and environmental disasters, leading to economic instability.
In addition, the state education system faces significant challenges, with the state often ranking low in national education rankings. It limits opportunities for high-paying jobs, perpetuating the cycle of poverty. Louisiana’s literacy rate is around 73%, meaning roughly 27.1% of the state’s population lacks basic literacy skills.
Mississippi
- Poverty Rate: 18.0%
- Unemployment Rate: 3.6%
- Average Salary: ~$49,090 a year
- Estimated population: 2.94 million
Mississippi often tops the list of the poorest states in America. The state has a complex history and faces several challenges to its current economic status. Unfortunately, the Mississippi Delta, once the heart of American slavery, is a significant factor in the state’s poverty.
Beyond that, Mississippi’s economy is heavily dependent on agriculture, manufacturing, and healthcare. Even though these industries create jobs, their pay is frequently lower than other sectors. Consequently, the state’s citizens will earn less money overall. Mississippi also has the lowest median household income of any state at $59,127.
Educational attainment plays a crucial role in securing good-paying jobs. Unfortunately, the state has a lower graduation rate than the national average. Mississippi has a literacy rate of around 72%, indicating approximately 28% of the state’s population lacks basic literacy skills.
New Mexico
- Poverty Rate: 17.8%
- Unemployment Rate: 4.8%
- Average Salary: ~$57,460 a year
- Estimated population: 2.13 million
According to research, New Mexico frequently has one of the highest percentages of the poorest states in America. Many jobs in the state offer wages below $12 an hour, making it difficult for families to make ends meet. As such, it creates a situation where people work but still struggle financially.
Moreover, New Mexico has lower educational attainment rates than the national average, along with one of the higher shares of adults nationwide who lack basic literacy skills. This can limit job opportunities and earning potential.
The cost of living, particularly housing, has been rising in New Mexico, further straining low-income families. The average home value in New Mexico is $303,286. Poverty is more concentrated in rural areas, where access to resources and job opportunities may be more limited.
West Virginia
- Poverty Rate: 16.7%
- Unemployment Rate: 4.1%
- Average Salary: ~$55,220 a year
- Estimated population: 1.77 million
West Virginia consistently ranks among the poorest states in the US. The state’s economy has historically relied heavily on coal mining. Consequently, the decline of the coal industry has resulted in job losses and decreased tax revenue for the state.
Beyond that, the state has one of the lowest percentages of residents with bachelor’s degrees, which limits opportunities for higher-paying jobs. Many young people leave the state seeking better job prospects elsewhere.
Furthermore, the state’s rocky geography can make infrastructure development and attracting new businesses more difficult. However, initiatives are in progress to restore the West Virginia economy. These include promoting tourism, attracting new industries like technology and renewable energy, and investing in education and infrastructure.
Kentucky
- Poverty Rate: 16.4%
- Unemployment Rate: 4.7%
- Average Salary: ~$59,180 a year
- Estimated population: 4.54 million
Manufacturing has always been a major element of Kentucky’s economy, especially coal mining and auto manufacturing. As these industries decline, good-paying jobs become scarce. Many Kentuckians are thus having difficulty finding employment that pays a livable salary.
Furthermore, Kentucky has one of the lowest minimum wages in the country, which makes it harder for full-time workers to lift themselves and their families out of poverty.
Additionally, some argue that Kentucky may not have as extensive social safety net programs. This may reduce the resources available to communities to help them escape poverty. With a 78.1% literacy rate, almost 21.9% of people in Kentucky do not have basic reading and writing skills.
Oklahoma
- Poverty Rate: 15.9%
- Unemployment Rate: 4.3%
- Average Salary: ~$57,670 a year
- Estimated population: 4.08 million
Many jobs in Oklahoma fall short of providing a living wage. Even with full-time employment, people struggle to make ends meet. The public school system faces funding challenges, impacting the quality of education. The state also has a 79.9% literacy rate.
Poverty is also linked to poor health outcomes. Thus, rural areas in Oklahoma often face limited access to high-paying jobs, educational resources, and healthcare facilities. As a result, this state is among the poorest states in America, and its remoteness traps individuals.
Above all, poverty is a complex issue with no single solution. However, addressing these factors through better educational opportunities, job training programs, and social support systems can create a path forward for Oklahoma and other states facing similar challenges.
Arkansas
- Poverty Rate: 15.7%
- Unemployment Rate: 4.0%
- Average Salary: ~$58,600 a year
- Estimated population: 3.09 million
Arkansas has a rich cultural heritage but faces several socioeconomic challenges. Poultry raising and other agricultural products is a major industry in the state. However, these sectors frequently experience natural disasters and changes in international markets, which cause financial instability. Thus, the state is often listed among the poorest states in America.
Moreover, the state has inadequate access to employment opportunities partly tied to lower literacy levels than the national average. This is often traced back to the labor market and stands among the poorest states in America.
The state’s geographical and climatic impacts the economy and quality of life. Despite these challenges, Arkansas is known for its beautiful vibrant culture. Efforts are also ongoing to address these issues and improve the state’s economy and quality of life for its residents.
Alabama
- Poverty Rate: 15.6%
- Unemployment Rate: 3.4%
- Average Salary: ~$60,530 a year
- Estimated population: 5.16 million
Alabama’s economy was reliant on slave labor for cotton production. After emancipation, the shift to a free market left many Black families without land or resources. Consequently, segregation and discriminatory policies further limited economic mobility for generations.
The state’s economic development strategy focused on attracting low-skill, low-wage industries like textiles. While this initially brought jobs, it didn’t offer pathways to higher wages or economic security. Globalization and automation have also led to job losses in these sectors.
In addition, the educational system also faces challenges that could hinder the opportunities available to the state’s citizens. Roughly 14.8% of its people do not have basic literacy abilities. Plus, a large amount of the state’s tax structure is made up of sales taxes, which negatively affect those with lower incomes.
New York
- Poverty Rate: 14.2%
- Unemployment Rate: 4.4%
- Average Salary: ~$104,780 a year (skewed upward by high finance-sector pay)
- Estimated population: 19.87 million
New York is the surprise entry on this list, and it catches most readers off guard. The state is home to Wall Street and some of the highest incomes in the country, yet it also carries one of the highest state poverty rates in America.
The gap between New York City’s cost of living and what many residents actually earn is a big part of the story. Rent, groceries, and childcare in the city consume a much larger share of income than the state’s headline median income of $85,820 would suggest.
There are also deep pockets of poverty upstate that get far less national attention than the city does. Rural counties in western and northern New York deal with many of the same job access and infrastructure challenges seen in other states on this list.
Tennessee
- Poverty Rate: 14.0%
- Unemployment Rate: 3.4%
- Average Salary: ~$65,730 a year
- Estimated population: 7.24 million
Statistics show a correlation between education level and poverty rates. While educational attainment in Tennessee has improved, there’s still a gap compared to the national average. This can limit job prospects and earning potential.
Besides that, the state is generally lower than the national average, and the cost of living can vary significantly within Tennessee. Poverty rates tend to be higher in rural areas of the state. These areas often have limited access to quality education, healthcare, and job opportunities.
Above all, Tennessee can strive to create a more equitable future for all its residents. Programs that provide job training and education can equip residents with the skills needed for higher-paying jobs. With a 68% literacy rate, over 32% of Tennesseans are not proficient in the fundamentals of literacy.
Final Thought
We explored the poorest states in America and learned that poverty is deeply intertwined with factors like education, industry, and history. Consequently, each state shares unique and common challenges that contribute to its high poverty rates. However, by understanding the historical and economic factors at play, we can work towards creating a more equitable future.
Above all, what can we do to address poverty in these states? How can we ensure that everyone, regardless of where they live, has access to quality education, good-paying jobs, and a decent standard of living? These are questions that require our collective thought and action. Thanks for reading!
Neelmani Yadav
FAQs
- What are the 10 richest states in America?
Massachusetts, New Jersey, Maryland, Hawaii, California, New Hampshire, Washington, Colorado, Utah, and Connecticut currently have the highest median household incomes in the country.
- Which 10 states have the highest poverty rate?
Louisiana, Mississippi, New Mexico, West Virginia, Kentucky, Oklahoma, Arkansas, Alabama, New York, and Tennessee currently have the highest poverty rates in the country.
- What is the richest state vs. the poorest state?
Massachusetts is the richest state by median household income at $104,828, while Mississippi is the poorest at $59,127, a gap of nearly $46,000 a year.