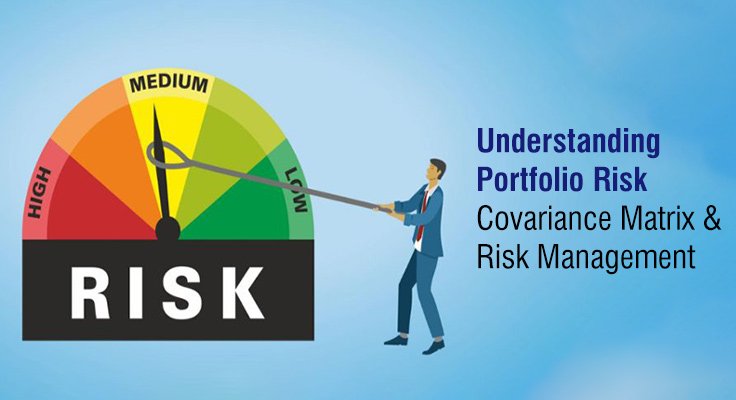
From Intuition to Measurable Risk
Before the 1950s, investing was mostly based on judgment and qualitative research. Investors spent time reading balance sheets and following news to decide where to invest. This changed when Harry Markowitz introduced Modern Portfolio Theory. He shifted the focus from individual stocks to how assets behave together. This marked a major shift toward quantitative finance and demonstrated that risk can be measured using data. Today, understanding portfolio risk means studying how assets interact and using that insight to protect capital. This is a key concept in any quantitative finance course.
Defining Asset Returns and Individual Risk
To understand a portfolio, it is important to first understand a single asset. The return of an asset is the percentage change in its value over a period. Since future prices are uncertain, returns are treated as random. By studying past data, we can estimate the average return.
However, the average does not show how much prices move. That is where variance comes in. It measures how far returns move from the average. Variance is difficult to interpret because it is measured in squared units. By taking its square root, we get the standard deviation, which expresses risk in the same percentage terms as your returns. If a stock has an average return of 10% and a standard deviation of 5%, you can estimate a typical range of price swings, although real-world returns may deviate from a normal distribution. This is the most common way to measure risk. A higher standard deviation means higher volatility and higher risk. This forms the foundation of risk management in trading.
Understanding Covariance and Asset Relationships
When more than one asset is involved, their relationship becomes important. This is measured using covariance. If two assets move in the same direction, their covariance is positive. If they move in opposite directions, it is negative. If there is no clear relationship, covariance is close to zero.
For example, two companies in the same sector may move together, while companies in different sectors may move in different directions. While quants use the Matrix Variance-Covariance for calculations, they use the Correlation Matrix for visual analysis. Correlation scales the relationship between -1 and +1. A correlation of -1.0 means assets move in perfect opposition, which can provide strong diversification benefits, although such relationships are rare and often unstable.
The Role of the Matrix Variance-Covariance
As the number of assets increases, tracking relationships becomes complex. This is where the matrix variance-covariance approach is used. It organizes all asset risks and relationships into a structured format.
The diagonal elements of this matrix represent the variance of each asset. These show the individual risk levels. The other elements represent covariance between pairs of assets. This allows traders to quickly understand which assets move together and which do not. The matrix variance-covariance framework is widely used in portfolio construction and is a key concept in any quantitative finance course.
Modern Portfolio Theory and Diversification
Modern Portfolio Theory shows that total portfolio risk is not just the average of individual risks. Because of covariance, combining assets can reduce overall risk. This is the idea behind diversification.
If assets do not move together, the portfolio’s overall volatility can often be reduced without proportionally lowering expected returns. This creates an efficient portfolio. In Python, quants use ‘Optimization Solvers’ to find the Efficient Frontier. This is a curved line on a graph that represents the ‘Goldilocks’ portfolios: those that offer the maximum possible return for every unit of risk you are willing to take. This concept is central to risk management in trading and helps investors make better allocation decisions.
Strategic Risk Management Techniques
Managing a portfolio also requires daily discipline. One important method is position sizing. This means limiting the amount of capital invested in a single trade. Even if one trade fails, the portfolio as a whole remains protected. Another tool is the stop loss order, which automatically exits a position at a predefined level. This helps reduce discretionary decision-making, although execution and market conditions can still affect outcomes
True portfolio risk management also requires dynamic rebalancing. Because asset correlations change over time, especially during market crashes when different stocks suddenly start moving in lockstep, a quantitative system must periodically recalculate the covariance matrix. This allows the trader to ‘prune’ positions that have become too correlated to the rest of the portfolio, helping maintain diversification benefits, although correlations can change unpredictably over time.
Traders also use hedging, taking an opposite position in another asset to reduce risk. These techniques help maintain stability amid changing market conditions.
Evaluating Risk with Beta
In addition to internal relationships, it is important to understand how a portfolio reacts to the overall market. Beta measures this relationship based on historical data, although it may not fully capture future market behavior..
A beta of 1 means the portfolio moves with the market. A beta above 1 means higher volatility, while a beta below 1 indicates lower volatility. This helps investors decide whether their portfolio matches their risk tolerance. Understanding beta is an important part of risk management in trading.
Using Python for Risk Analysis
In practice, these calculations are done using tools rather than manually. Python is widely used for its efficiency and extensive library ecosystem. Traders use tools like yfinance to collect data, pandas to organize it, and NumPy to perform calculations.
With these tools, it is possible to build a matrix variance-covariance model for many assets in a short time. This also allows traders to test strategies using historical data, although past performance does not guarantee similar results in live markets. Such testing helps in understanding how a portfolio might behave during different market conditions.
A Real Learning Journey
Elías Andrés Gaete Fuenzalida from Chile had a strong background in finance and teaching but wanted to move into quantitative trading. He enrolled in the EPAT from QuantInsti to gain a structured pathway into the field. Despite challenges such as learning Python from scratch, managing a full-time job, and overcoming language barriers, he progressed through the program with consistent effort.
As part of his learning, he developed a portfolio strategy focused on diversification and risk-based rebalancing. With guidance from mentors and hands-on project work, he gained practical exposure to portfolio construction and risk management, strengthening his foundation in quantitative finance.
Advancing Your Knowledge
To build deeper expertise in these concepts, structured learning plays an important role. Live classes, expert faculty, and placement support are key features of the EPAT program by QuantInsti. The program highlights real outcomes such as salary insights, hiring partners, and alumni experiences, helping learners understand career pathways.
Quantra courses complement this by offering flexible learning options. Some courses are free for beginners starting with algo or quant trading, though not all courses are free. The platform follows a modular structure and focuses on a learn by coding approach. With affordable pricing and a free starter course, learners can build strong foundations in topics like matrix variance, covariance, and risk management in trading at their own pace.
Also Read: 8 Practical Employee Management Tips for Small Businesses